Differentiating the deeper causes of income inequality from those that are more accidental is difficult. When we examine our own particular environments, it is natural that we should focus on our immediate surroundings: our colleagues, neighbors and fellow citizens. We don’t often think about how those on the other side of the world are faring. If nothing else, this apparent myopia is justified by a belief that we have greater influence in our own neighborhood than in the antipodes, or that what happens abroad is simply out of our control. That is why we tend to think about income distribution from a national perspective, rather than a global one. The following story, which inspired the title of this article, can be helpful for grasping the problem.
The reader may not know the story of “The Gorilla in the Room”, but it reveals the fact that while we focus on one thing, we often fail to see another, much more important story happening at the same time. Now, let us apply the lesson of the story to income inequality. Consider 1988 to 2008, when the main economic event to take place was the expansion of global markets, starting with the appearance of China, Eastern Europe and, to a lesser extent, India on the world economic scene, and ending with the onset of the current crisis. World income as a whole has grown enormously thanks to this larger market, but not everyone has benefited in the same measure. Since we hear every day about the plight of the middle classes, let us ask the question, how have they fared?

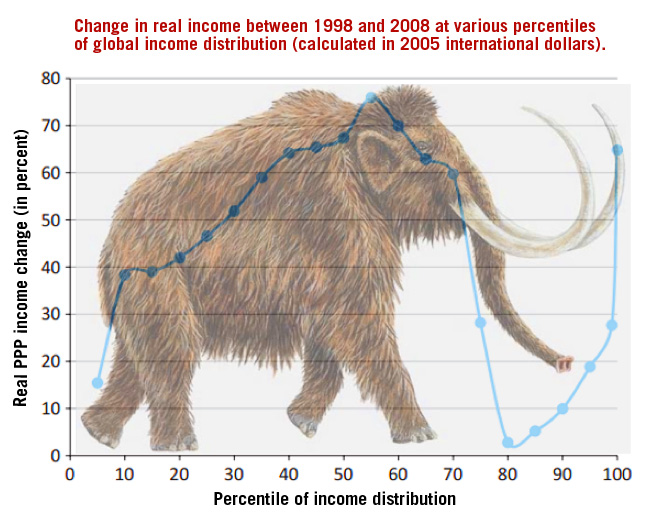
On its horizontal axis, the figure features deciles of the world’s income distribution: 10 corresponds to the poorest 10 percent, 20 to the next poorest, all the way to the richest 10 percent, starting at 90 and reaching, say, 99 – the richest 1 percent. The vertical axis measures the cumulative real per capita household income gain from 1988 to 2008 in percentages.
This figure shows how much each segment of the world’s population has seen its average income grow during the entire period. The shape of the graph resembles a mammoth, hence the title of this article.
Following the economist Branko Milanović, we can distinguish three points on the figure:
- Point A, at the top of the mammoth’s head
- Point B, below the tip of its trunk
- Point C, at the tip of its tusks.
Point A corresponds on the horizontal axis to a point that is a little to the right of the 50 mark – the median – that separates the world population in two halves: a poorer one to the left and a richer one to the right.
Those around A, between the 40 and 60 marks, are those who have done best. On average, their income has grown almost 80 percent in 30 years. They are the winners of this big change. Who are they? Mostly the emerging middle classes of East and South Asian countries, especially China, but also Indonesia and Vietnam (South Korea and Japan are to the right of the median).
Around point B, at the 80th centile, we find the losers: no growth for the last generation. Who are they? The not-quite-rich of the rich countries, the lower-middle to middle class of North America and Europe; the lower half of countries like Germany. In short, most of us. Lastly, the world’s richest meet at point C, the upper 1 percent. Half of its inhabitants are U.S. citizens, the rest come from Western Europe, Japan, Oceania, Brazil and South Africa. They, too, have done well: their average income has grown by 60 percent since 1988.
The distance to the right, between points B and C explains the current wrath of the rich countries’ middle classes: they have not progressed at all during the crisis, while witnessing the rich further enrich themselves. That accounts for most of the increase in inequality within rich countries. But what has happened on the left is much more important. This is because:
- It predates the crisis
- It has potentially greater impact
- It lies entirely beyond the reach of national economic policies
It is the true mammoth in the room.
A large part of the story is simply the result of globalization: trade has made labor less scarce in richer countries (since products that use a lot of labor are simply imported from emerging economies), hence relatively cheaper.
So labor in richer countries has been the loser, while in emerging economies it has been the winner. Furthermore, globalization is not only trade: entire production units are built abroad to replace those at home (what we call outsourcing and offshoring), and a lot of the middle-skilled jobs, both in production and in administration and management, are exported along with them.
In simple terms: under free trade, wages converge. But where? At the Norwegian level (€50/hour) or the Philippine level (€1.10/hour)? This simple theory does not tell us, but history may help.
Those at the top of the mammoth will continue to catch up with richer countries, whose middle classes should not expect to see their relative position improve much. Significant redistribution within each country, even if politically feasible, will in all likelihood not be enough to compensate for the push from behind – a push that will come from 80 percent of the world’s population.
On the other hand, perhaps we shouldn’t complain too much, since the losers of globalization are, on average, 10 times richer today than the winners. Furthermore, one should be wary of taking any of the above as more than a suggestion. After all, our world is not at peace and by looking too closely at our mammoth, we may fail to see even bigger beasts in the room.


very gooooooood
http://redstarmezon.com