
Once again, we are pleased to present the fifth edition of our IESE Cities in Motion Index (CIMI). We have observed with great satisfaction how various cities, companies and other social actors have used our study to carry out a comprehensive first diagnosis and an initial benchmarking of other major cities through comparative analysis.
As in previous editions, we have tried to provide an index that is objective, comprehensive, wide-ranging and guided by the criteria of conceptual relevance and statistical rigor. The 2018 edition of the CIMI includes 165 cities – 74 of them capitals – representing 80 countries, for three consecutive years (2015-2017).
CIMI 2018: Updates
From its beginnings, the CIMI has aimed to improve year after year. This fifth edition is no exception, presenting some important improvements and updates. First, the number of indicators used at the city level has been significantly increased, with a total of 83 indicators – such as the number of terrorist attacks, the number of Apple Stores and the compliance levels of ISO 37120 (known as the smart city standard) -, enriching the analysis with new data.
Second, although this edition has a smaller number of cities compared to the previous edition, 13 new cities have been incorporated, including Reykjavik (Iceland), Bern (Switzerland), Wellington (New Zealand) and San Diego (USA), among others.
Lastly, this edition merges two dimensions of our conceptual model, which originally took into account 10 key dimensions: human capital, social cohesion, the economy, public management, governance, the environment, mobility and transportation, urban planning, international outreach and technology. We have merged “governance” with “public management” in this edition (in a dimension called simply “governance”), due to certain conceptual overlap and the limited number of indicators available at city level. The different measures offer a broad and integrating vision of what a city represents, while allowing a greater understanding of time and its evolution.
General Ranking
Once again, New York (1) remains the world leader, followed by London (2) and Paris (3). The rest of the top 10 cities in the overall ranking are: Tokyo (4), Reykjavik (5), Singapore (6), Seoul (7), Toronto (8), Hong Kong (9) and Amsterdam (10).
New York is in first place of the overall ranking thanks to its performance in the dimensions of the economy (#1), urban planning (#1), international outreach (#3), human capital (#4), and mobility and transportation (#4). However, the city continues to be in very low positions in the dimensions of social cohesion (#109) and the environment (#99).
Analysis of Dimensions in Pairs
Another novelty of this year’s edition is the analysis of dimensions in pairs. This analysis has been developed with the aim to help cities understand the relationships, interactions and trade-offs between different dimensions. Moreover, cities are analyzed by population (i.e. the smallest cities; small; medium; large; and megacities) which is also an innovation of this edition.
Figure 1 below exhibits the relationship between the economy and social cohesion.
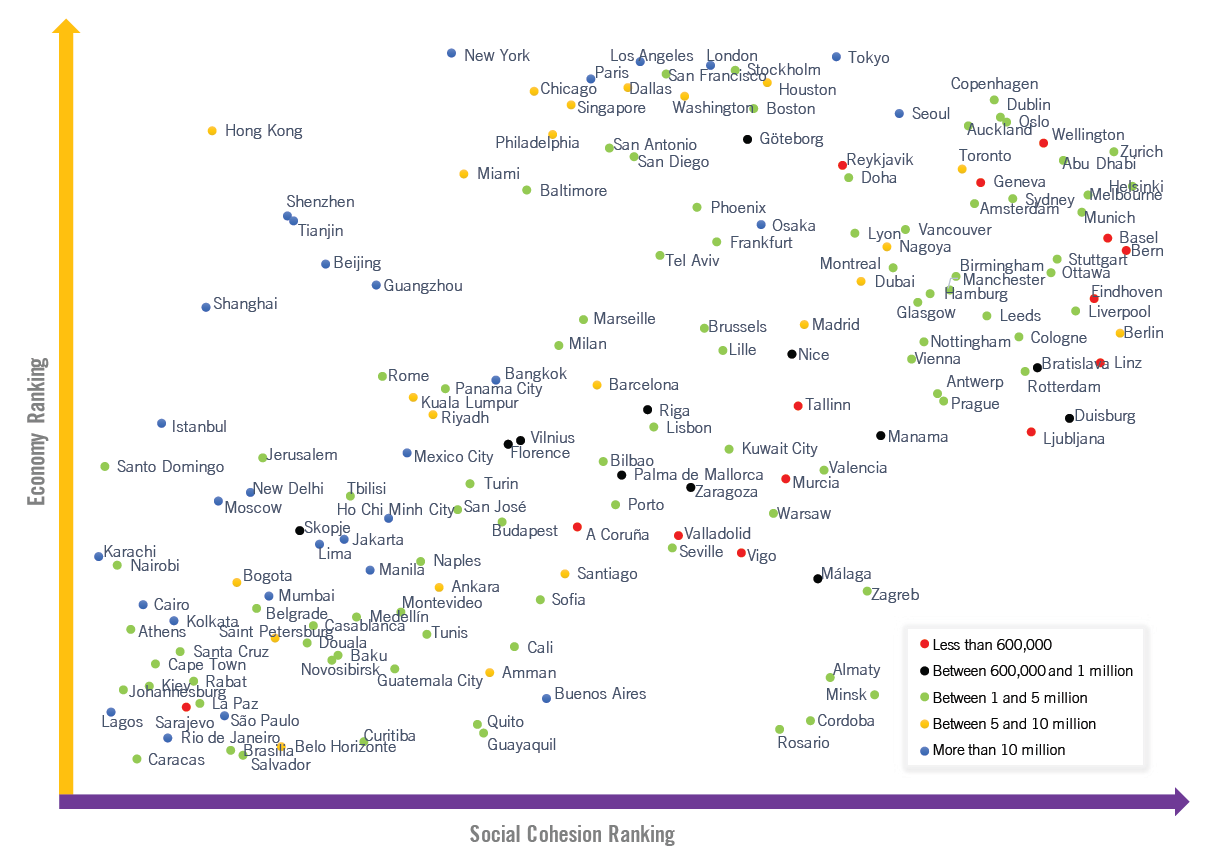
The “smallest cities” perform well in the dimension of social cohesion, as can be seen by their position on the right of the graph. Similarly, many of these cities also perform well in the economy dimension. A large number of “megacities,” on the other hand, show relatively good performance in the economy dimension but, in general, very poor performance in the dimension of social cohesion. It can also be seen that the Chinese cities – such as Hong Kong, Shenzhen, Beijing and Shanghai – are grouped in the upper left of the graph, indicating good performance in the economy and poor performance in social cohesion.
Figure 2 analyzes the dimensions of the economy and the environment.
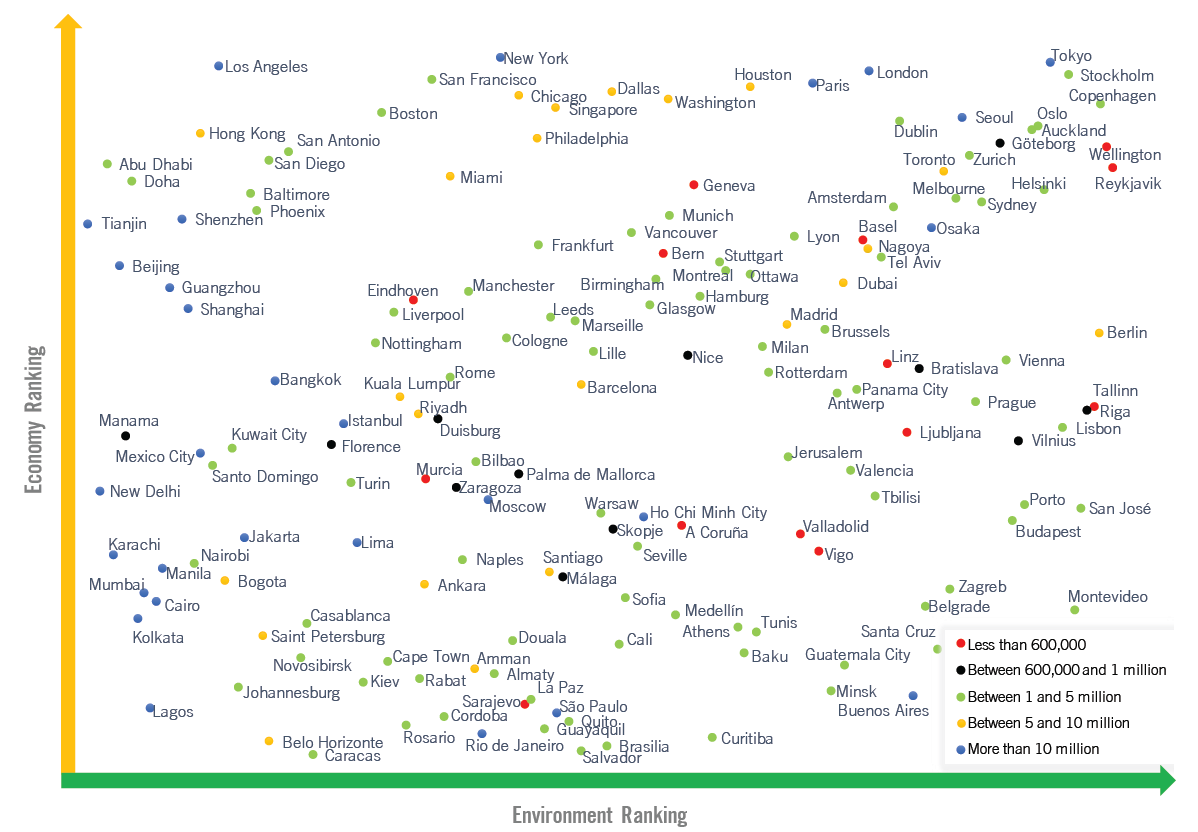
The Chinese and U.S. cities are found in the upper left of the graph. These cities stand out because they perform well in the area of the economy but poorly in the environment. The cities in the upper right show good performance in both the economy and the environment. This group includes a large number of European cities, such as Stockholm, Copenhagen, Oslo, Göteborg, Reykjavik and Zurich, as well as Asian cities such as Tokyo and Seoul and some from Oceania such as Wellington, Auckland and Sydney. Some of the “smallest cities,” such as Reykjavik and Wellington, also stand out in this group. In the lower left corner, there are cities with a poor performance in both dimensions, such as Lagos, Jakarta, Cairo and Johannesburg. A conclusion could be drawn that a high degree of economic development is often related to poor performance in the environmental field if cities do not take ecological criteria into account during that development.
Lastly, Figure 3 shows the dimensions of mobility and transportation and the environment.
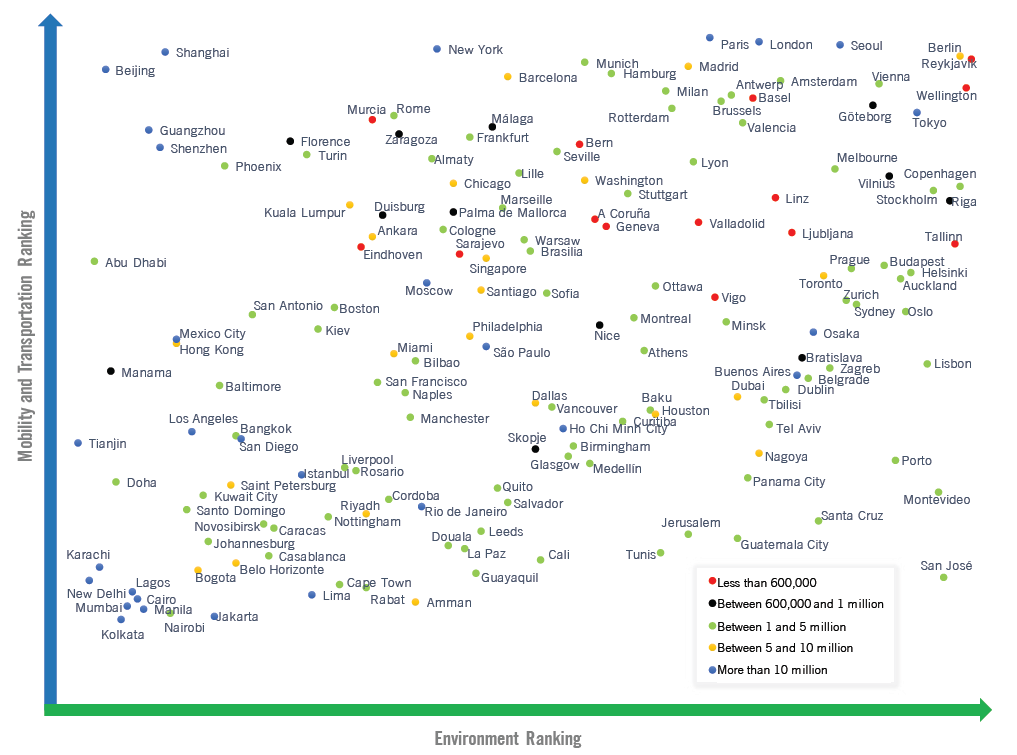
Here we see at the top of the graph that the “smallest” and “small” cities perform well in mobility and transportation. Some of them also demonstrate good performance in the environment, as is the case with Reykjavik and Wellington. The upper left of the graph shows cities that perform well in mobility and transportation but poorly in the environment dimension. Here we find the Chinese “megacities” and some North American ones such as Phoenix. The upper right-hand side shows the cities that perform well in both dimensions. The smallest cities – such as Basel, Reykjavik, Wellington, Geneva and Bern – are mostly located here. The lower left shows the cities with low degrees of development in mobility and transportation and also in the environment, including cities such as Manila, Mumbai, Nairobi and Kolkata. Finally, the lower right-hand side shows the cities that have a high degree of environmental development but a poor performance in mobility and transportation. In this group we find cities from Central and South America, such as Montevideo, Santa Cruz, San José and Guatemala, as well as cities in the Middle East, such as Jerusalem and Tel Aviv.
Preparing the Transformation
Urban managers face significant obstacles – such as mobility, aging populations, increases in inequality, poverty, pollution, among others – to make our cities better environments in which to live, work and enjoy life. The scope and magnitude of these challenges demonstrate the need for the world’s cities to undertake a strategic review process. City leaders need to take a holistic approach and to adopt a long-term perspective to carry out the necessary transformations, since changes tend to be slow.
We recommend always starting with a proper diagnosis of the situation, establishing strategic priorities and defining the type of city they want to be. In this regard, the CIMI can be used as a diagnostic tool to carry out a first assessment of the current status of the city in the different dimensions of our model. The CIMI allows a quick X-ray to be taken of the cities, identifying their strengths and pointing out places where there is room for improvement.
Moreover, the benchmark can be the beginning of change. The ability to compare 165 cities across nine different dimensions allows us to identify those that perform best in the different areas of the city. It can help city managers understand the situation and how they can better manage urban systems Therefore, it should serve as a source of inspiration rather than as a road map for action. This report is our humble contribution to advancing this process.
More information on the offical website of IESE Cities in Motion and IESE Insight.
You can download the full report here: IESE Cities in Motion Index 2018.
Very good article, I liked the comparison and the descriptions of the cities. Congratulations
Excellent material for an initial benchmarking and can be used in business, congratulations!
Its a great transformation began step by step from one city to another one. i love to see detailed information about cities. Thanks
I congratulate all the multidisciplinary team that has worked on the collection, analysis, tabulation and graphs of the results.
Seeing all the global information that has come, requires a great effort, time, talent and money.
However, beyond the progress in the development of each of the cities in the list, it is advisable to evaluate other factors that affect or have a direct negative impact on the daily activities of residents in those cities.
Among those factors that can be added to future studies, we can mention:
The infrastructure such as streets, electrification, potable water supply, sanitary system, environmental health, solid waste collection and wii-fi among others.
Traffic
Public transport efficiency
Inflation
Unemployment
Bureaucracy and corruption.
Street nomenclature, signage and Digital mapping
Information to the tourist
Acces to emergency room and security services
Schools and Universities
Engineer Raymark Clément
great article as it can be used in business very detailed and organized which makes it easy to implement in a step by step manner
Hi! Could you please send me by e-mail the pdf which has the last full report for Cities in Motion Index 2018? The link on website just doesnt work, at least in Brazil…
Best regards,
Rafaela.
Hi Rafaela,
Please send us an email at: citiesinmotion@iese.edu.
Thank you very much in advanced,
i am glad to see that it is a great transformation began step by step from one city to another one