You have most probably been following quite closely the recent travel chaos in Europe. I certainly did, since I was one of those that went from “up in the air” to “up on a train”, experiencing a new notion of distance. It’s when traveling from Germany to Spain takes two days, rather than 2 hours.
Today, we are all seeing that airlines are claiming that
restrictions should be eased, and the no-fly ban should be ended soon, in order to prevent them from even more dramatic financial results. I don’t want to enter this discussion, but I do want to highlight which type of information should guide the decision to open up our airspaces again. It is a brilliant illustration of a recent cover of the Economist, on “The Data Deluge”. Why? Because in this case, very dramatically, decisions so far have been taken on a series of highly complex mathematical simulations. Hence, to properly understand the problem that is currently being discussed in the general press all over the world, we need to have a deeper look into the information that was taken into account to take the decisions of closing the aerial space in more and more countries.To start with a little bit of background information. The decision to close the airspace is based on an initial evidence that volcanic ash has a number of effects on planes, one of them being the loss of engine power, which is certainly critical. In the mid 80s, British Airways and KLM reported how their planes had been affected by poer loss after flying through ashes from volcanos in Indonesia and Alaska respectively. In order to prevent fatal accidents, the International Civil Aviation Organization (ICAO) asked for the establishment of volcano ash contingency plans. These plans, which indicate how many grams of ash particles and aircraft con fly through per hour before being affected, are the basis for the decision to close most of Europe’s airspace during the past weekend.
Today, the industry is raising voices that claim that the established level is extremely low, and that test flights are indicating that flying is safe. And here starts the critical issue. In order to know, we need facts. Facts means real data on the ash concentration at different heights. Do we have those data? For me, after having done some research about what data are being used during this discussion, the answer is highly unclear.
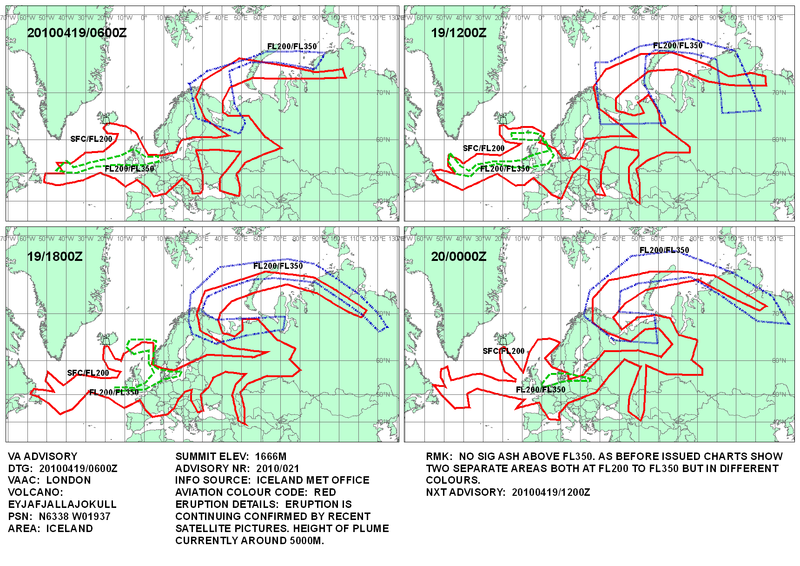
There is no doubt on that the decision to close the airspace has been taking based on a a forecast which in fact is highly sophisticated data simulation, issued by an agency run y the British Met Office, called London Volcanic Ash Adivisory Centre (VAAC). This centre is one of a network of 9 centres worldwide, and covers the affected volcanic area, Iceland. (For a map of all the centres, please have a look here). But, how does this simulation work? Basically, based on a number of initial data, they run a atmospheric dispersion model, called NAME, to predict the spread of volcanic ash plumes. Similar models are also used to predict the spread of a eventual chemical leakage, or even of an airborne disease, so they seem pretty proven. You probably have seen the output of running this forecasting model, it gives back a map like the following (I include the one that has been published this morning):

But again, we have to remember our initial question. We know the output of the model, and the decisions made based on that output, but what about the input data? A model can only be as good as the data it is using,that’s evident. Which essentially means that we should have a very close look at the input data. In the case of the London VAAC (which is part of the Met Office), data are collected to track the movement and dispersion of volcanic ash clouds using both polar orbiting satellites and geostationary satellites. Images are produced every 15 minutes, which is actually quite impressive, since this implies a large data stream, which is crucial for any data forecasting. In addition, the model allows to be complemented with other types of data, such as visual evidence, pilot reports, etc. All these basic data inputs are being fed into the NAME model, producing the final forecast, which is then used to issue the recommendations that the London VAAC issues. These recommendations so far have been the fundamental piece of information that both the British National Aviation Travel Service (NATS) and Eurocontrol have been using for their decision making about closing or opening airspaces. To track the London VAAC observations, please visit their blog.
You may be wondering: And what about other types of measures? Going out and measuring real concentration? Well, this is proven to be a complex task. The British Met office actually publishes all evidence they have on a meshup map (thanks to Google Map!), which I encourage you to visit to make your own judgment. Essentially, the map collects data from two types of sources: One is a so-called laser cloud base recorders (CBR), which are able to detect the presence of ash particles at different altitudes. The other source of information is what they call ad-hoc reports. These go from something like “Report from public of ash covering cars”, to “a layer of ash at 10000FT observed by parachutists”. Trustworthiness of these sources? As you can imagine, they have to be thoroughly followed up.
What is surprising to me is that during the weekend, according to the German FAZ, only the UK and Finland have done this sort of measuring, while on Continental Europe only one CBR measure has taken place. Actually, while the London VAAC is issuing new reports on a 6 hour basis since the start of this “Air-crisis”, the VAAC of Toulouse, in charge of the entire European Continent, Middle East, and Africa, has not issued any recommendation so far. I also haven’t been able to find any information about any additional activity from the Toulouse VAAC in the past days.
Hence, it is evident that we need more data about ash concentrations to complement existing data that have been used to run the complex simulations that have been driving the decisions about our airspaces. Can this evidence come from planes making trial flight with our well known jets? It is obvious that planes that fly may give us some additional evidence, but since Commercial planes don’t have the instruments to detect ashes nor their concentrations, the real amount of additional data they give us is scant. They may tell us that their inspection of the engines and other parts of the plane after a particular flight does not indicate sufficient concentration of ashes, but that is of little use to extrapolate to the entire airspace. What if the plane had be flying higher, or on a slightly different route? Where were the ashes if traces were to be found on a plane, exactly? Do we want to use this information to make a decision of opening our airspaces? Or are the basically creating buzz?
We should probably start understanding that we need to think further about the total body of data that we want to use for a more holistic analysis, rather than claiming that the existing model is “theoretical” and that this “doesn’t work“, as Mr Bisignani, of the International Air Transport Association, has claimed. This is not issue of substituting a mathematical model, but of improving it with more data. It is undeniable that the data that the model uses are extremely relevant. Hence, we should start finding useful data that may improve the model currently used. And as much as I regret it, I think that the news from Airline companies add little data to improve any decision, they just create buzz and a lot of pressure on the decision bodies. What is needed now is real measures. Measures from meterological stations all around Europe which are producing data that should be fed into the models. We also need to see real coordination among the London and the Toulouse VAAC, which I hope is happening, but for which no information can be found on the web despite a very intensive search for some joint news. And we need real in-the-air measures should complement CBR and other types of initiatives. But not from Commercial airplanes that cannot measure concentrations of ashes at different heights. We need real data collection. In Germany, is has been reported that today a first plane with that specific aim will start in Pfaffenhofen. This is a start, but more has to follow. At the end, it’s plane that will have to go again “up in the air”. But not to substitute the existing models, it’s to enrich them.


Excellent article, right on target. I would add that, till today, preset tolerance by aircraft engine manufacturers was zero for engines in regards to the volcanic ash ingestion and has not been till now, after the islandic volcano crisis, they have raised the bar.